Emissions and Energy
Overview
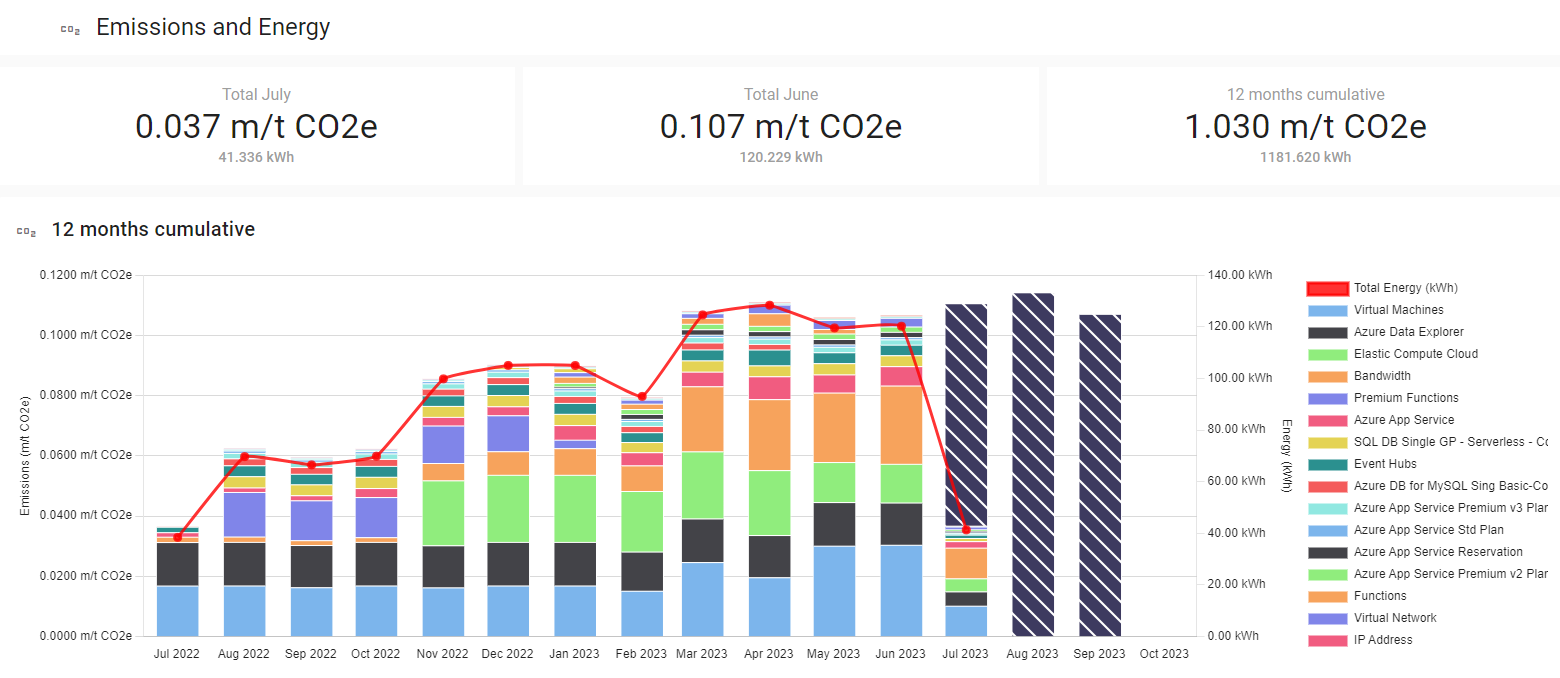
Cloud Ctrl Emissions and Energy provides an overview of Carbon Dioxide produced and KiloWatt hours consumed for all cloud accounts. It shows the projected emissions and energy for the current month, the totals for the previous month, as well as the cumulative totals for the year to date. Emissions and Energy are calculated using the model provided by the Cloud Carbon Footprint project.
Co2 12 months cumulative
A explorable graph for emissions and energy that can be used to answer questions quickly about emissions and energy in a tenant. For more in-depth exploration refer to the Emissions Explorer feature.
Emissions by Hierarchy
This view is based on tags and is can be configure by your organisation to report emissions and energy in a manner that better aligns to your organisations structure. This will display aggregated emissions and energy from accross all vendor accounts by the Tag keys that are configured in Settings -> General -> Tag Hierarchy.