Reporting
Cost Explorer
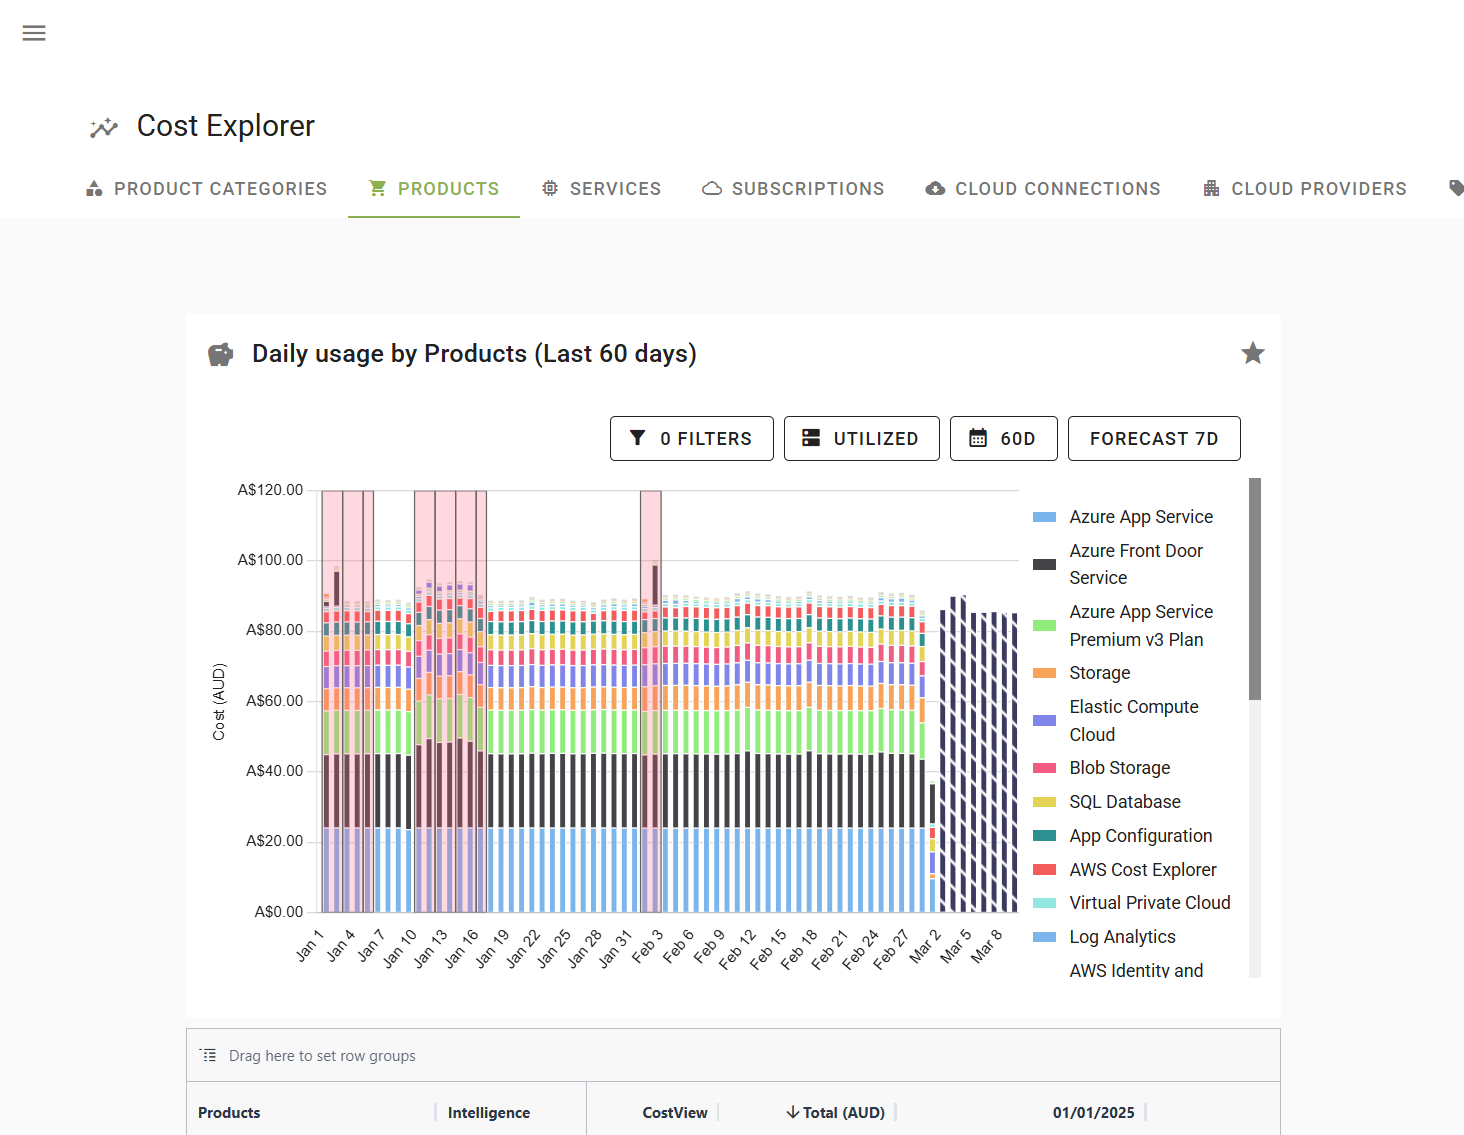
The cost explorer is the primary way to report on and generally explore your cloud consumption. You can view your spend by Products, Services, Subscriptions, Cloud Accounts as well as any tag hierarchy keys you may have configured earlier (see Configuring your Tag Heirachy).
Try configuring a new time range, filtering the scope of the results via the search bar in the card, and generally interacting with the charts themselves. As you do, you will find that the result set changes, and includes the Products, Services, Subscriptions or Tags below depending on the segregation you selected.
Selecting one of the results in the table will focus on that entity, but it will also persist the scope you're currently viewing from. From this focused dialog you can dig into the consumption of the entity more either through the usage or trends tab, or configure it in some way depending on what it is. For example the subscriptions dialog will allow you to configure it's spend limit and virtual tags.
Custom Reports
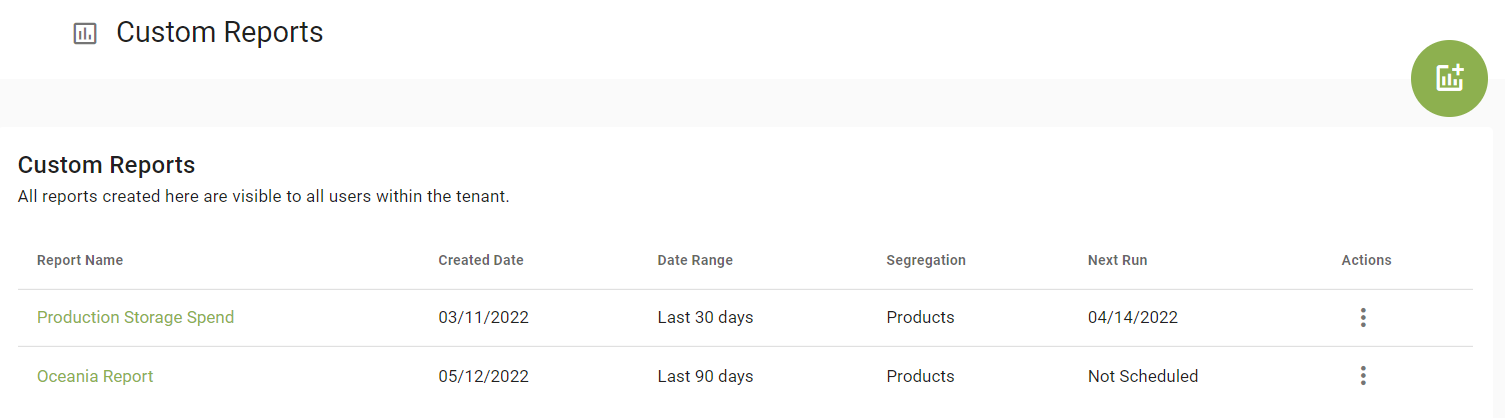
Custom reports allow delving into data of interest within your cloud consumption. You can view your spend by Products, Services, Subscriptions, Cloud Accounts across several date ranges or define your range.
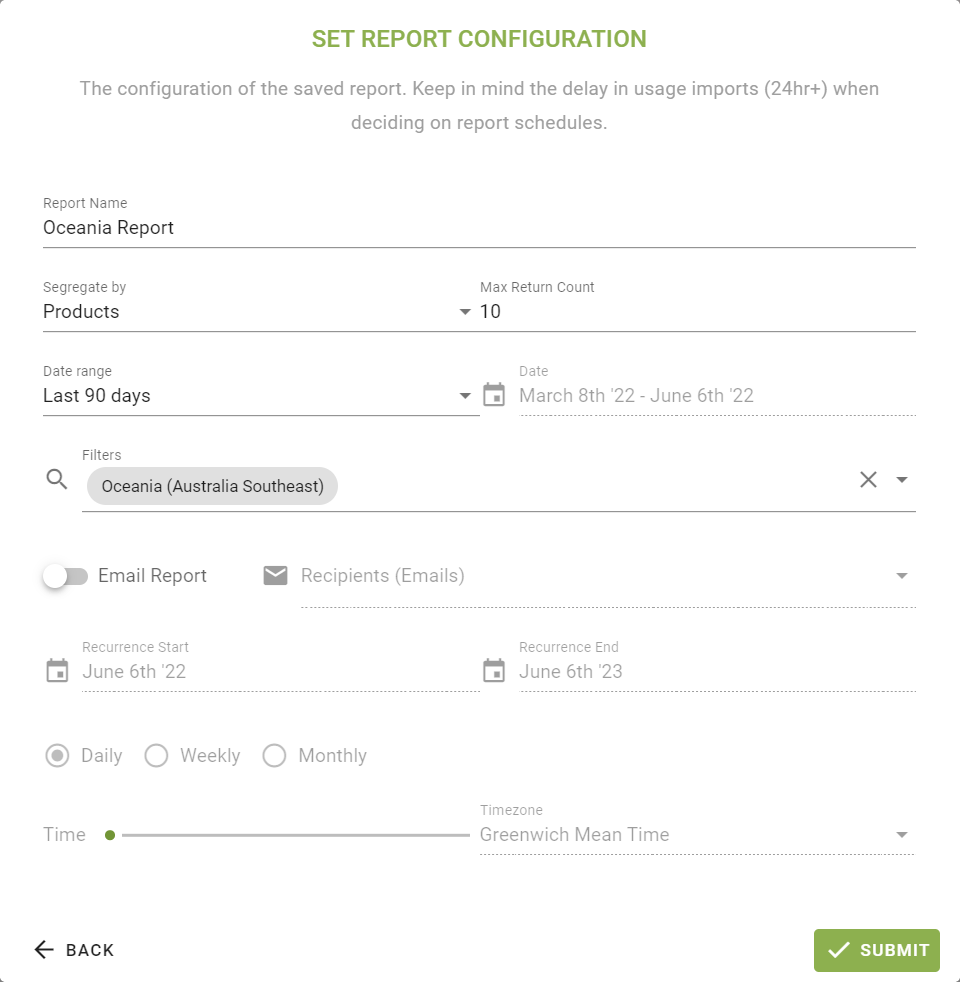
Reports are controlled by their configuration and can be filtered in a similar way to other places in the app. Try creating a new report and configuring a date range and filtering the scope of the results via the search bar in the card. Once submitted, you will find that the graph and result set changes, and includes the Products, Services, etc. below, depending on the segregation you selected.
Selecting one of the results in the table will focus on that entity. From this focused dialog you can dig into the consumption of the entity more, either through the usage or trends tab, or configure it in some way depending on what it is.
The configuration can be altered at any time in the future, including setting a frequency and time for delivery of the report.
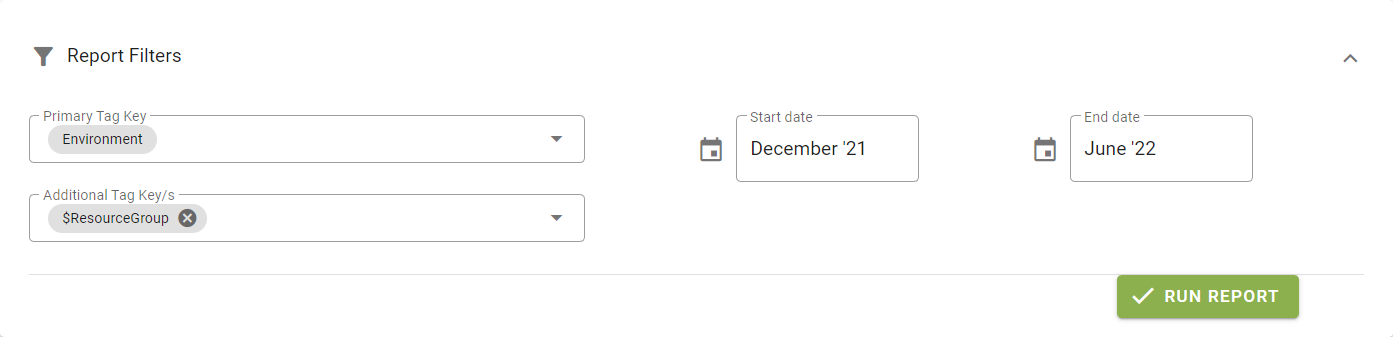
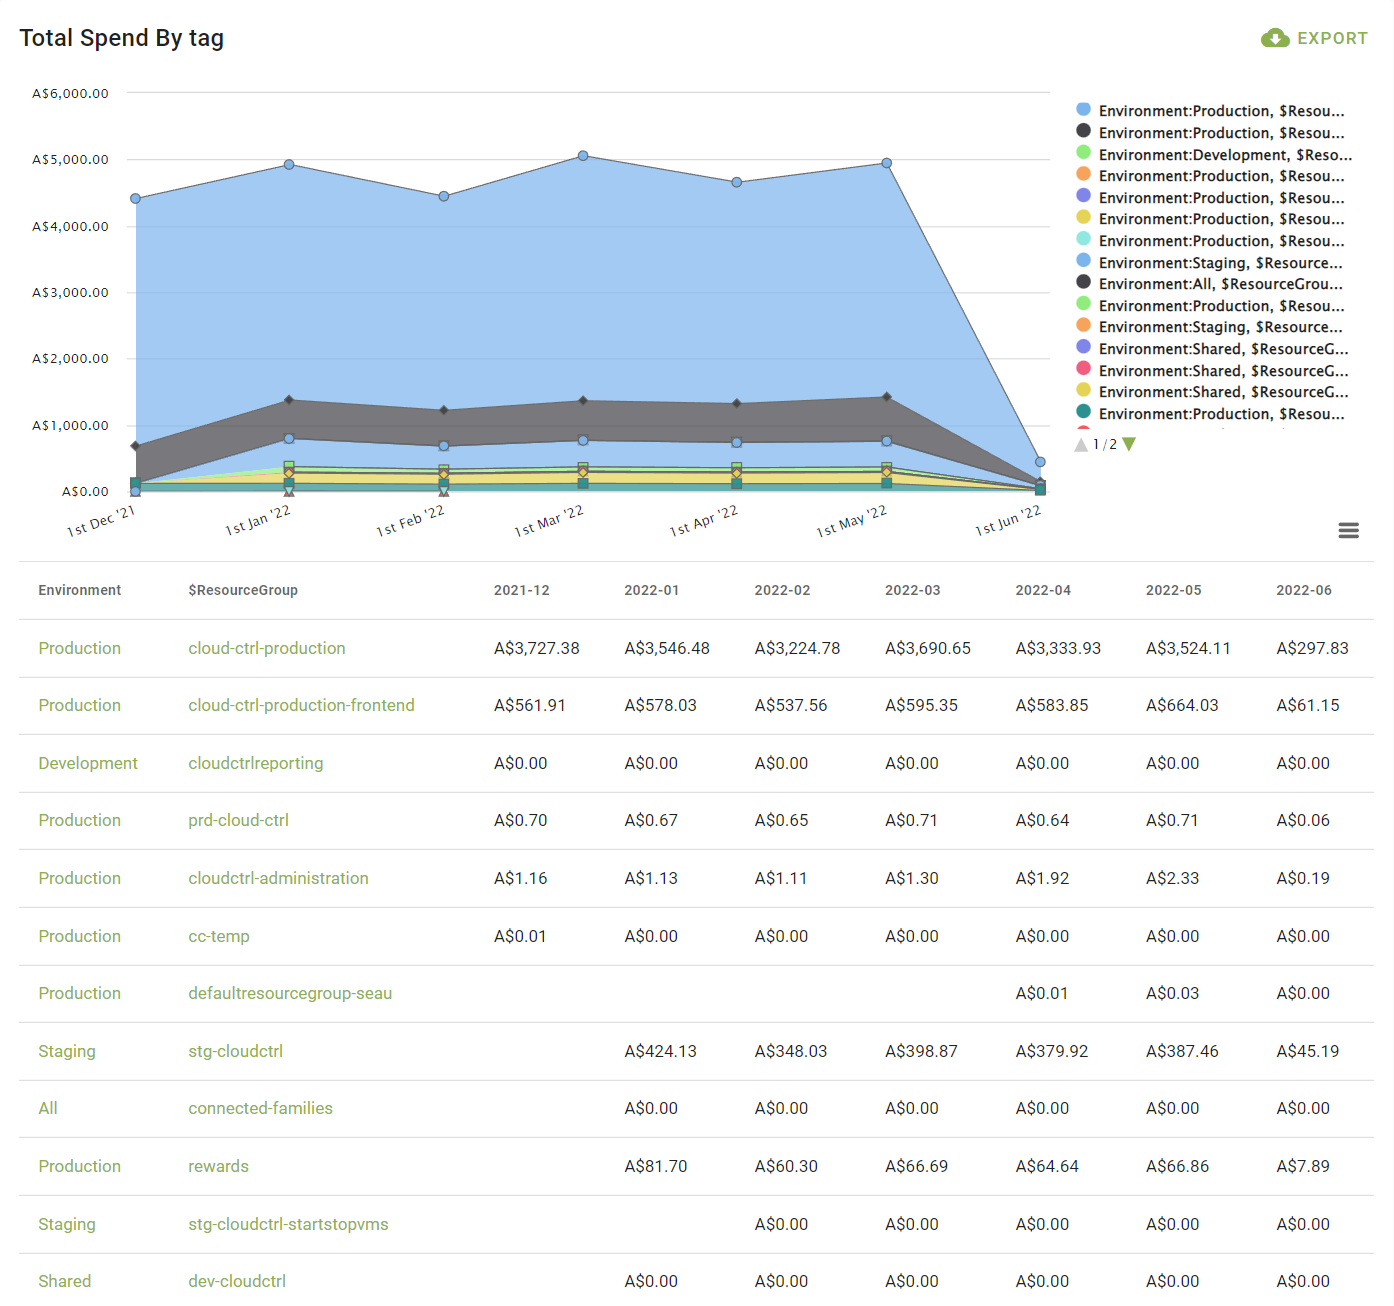
Tag Reports
Tag reports allow you to break down monthly spend by one or more (maximum 3) assigned tags.
Selecting one of the results in the table will focus on that entity. From this focused dialog you can dig into the consumption of the entity more, either through the usage or trends tab, or configure it in some way depending on what it is. System Tags can also be used when producing tag reports.