Costs and Usage
Overview
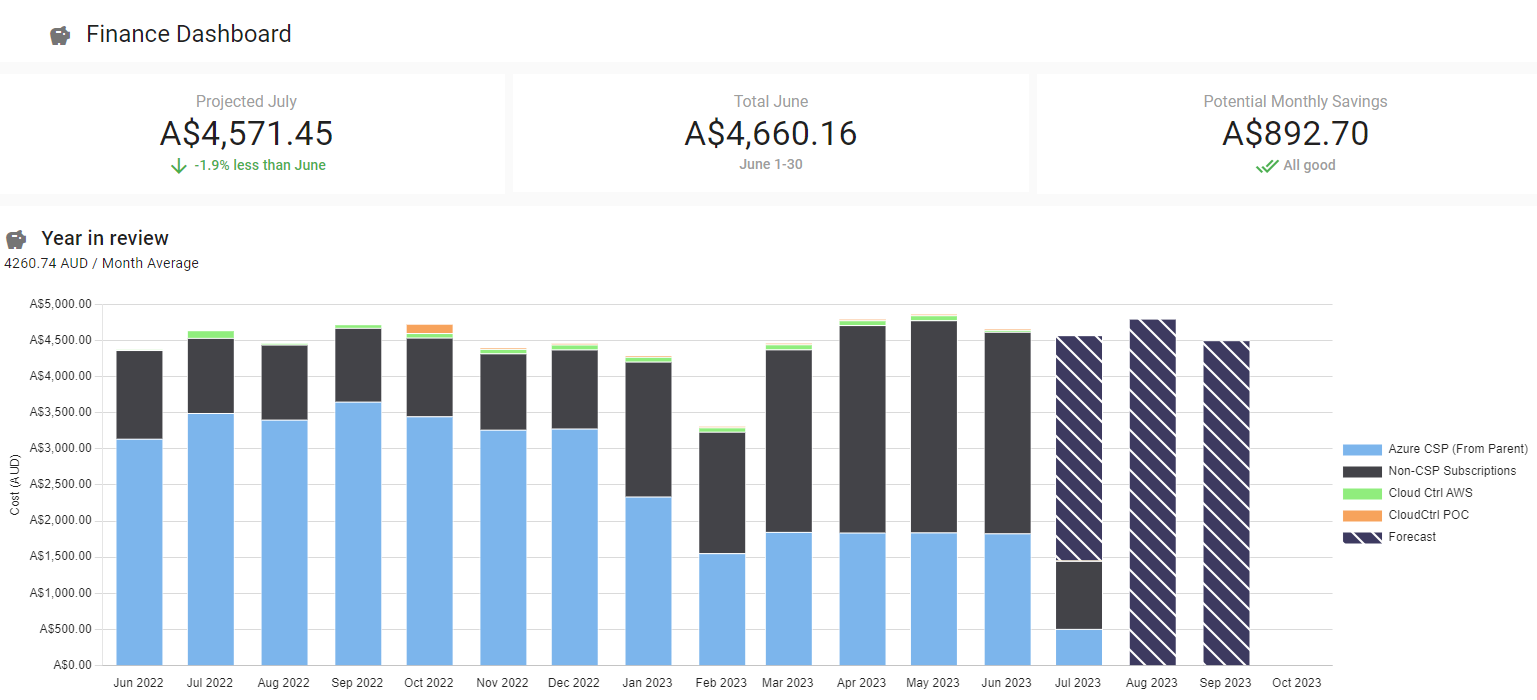
The Cloud Ctrl Finance dashboard provides a financial spend overview of all your cloud accounts. It shows the projected spend for the current calendar month, the total for the previous month for comparison, as well as any possible savings to be made by applying recommendations.
Year in review
A break down of the last 13 months (maximum stored range in Cloud Ctrl) of spend by account. This is useful for tracking the projected spend relative to arbitrary months as well as to get a sense for how your organization has been managing it's spend generally.
Usage by Hierarchy
This view is based on tags and is can be configure by your organisation to report spend in a manner that better aligns to your organisations structure. This will display aggregated spend from accross all vendor accounts by the Tag keys that are configured in Settings -> General -> Tag Hierarchy.
Cost Explorer
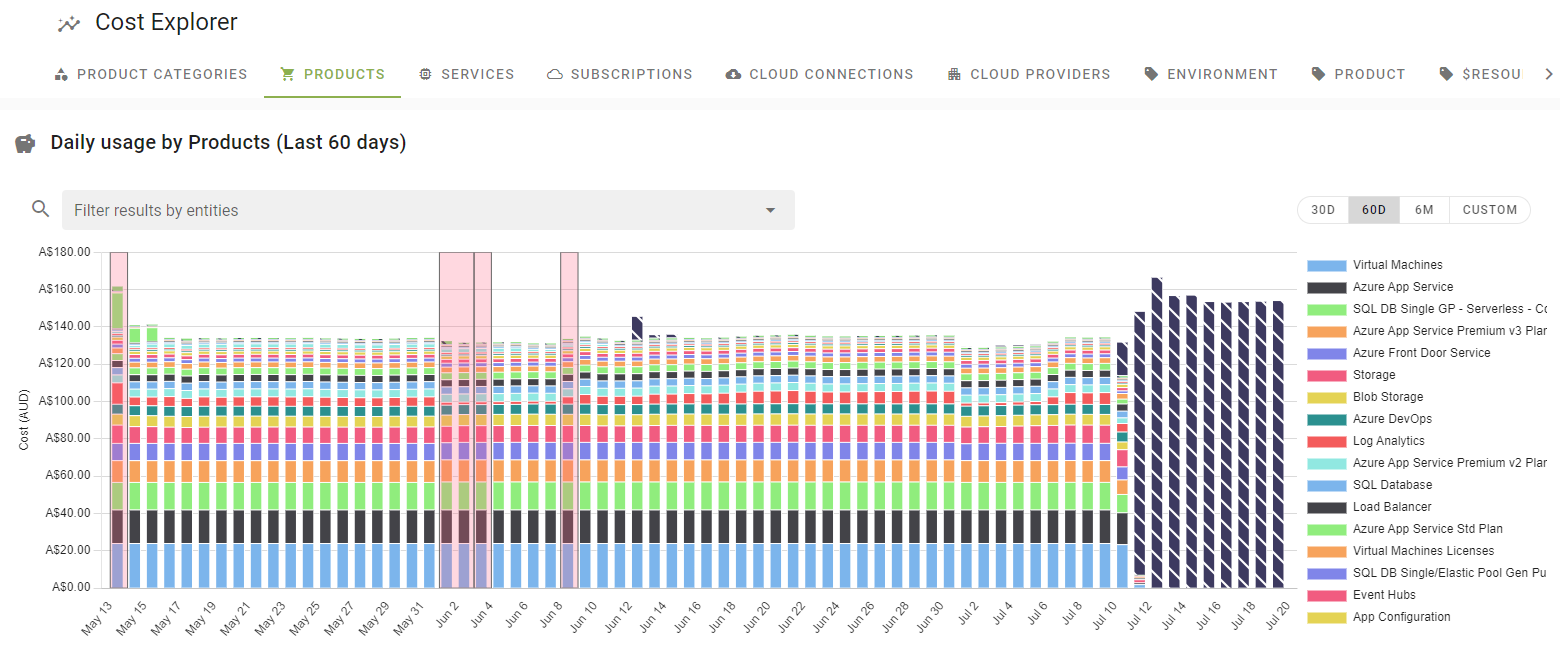
The Cloud Ctrl Cost Explorer dashboard provides a breakdown of spend by a range of helpful groupings. Apart from the standard groupings (Product Category, Product, Service, Subscription, Cloud Connection, Cloud Provider), any Tag Key configured in the Tag Hierarchy is also available as a grouping for spend breakdown. Filtering is also available in order to focus in on specific entities and will remain active when moving between top level groupings. Another method to focus on a particular item within a grouping, is by clicking on a single bar in the graph to drill into an entity.
Trends
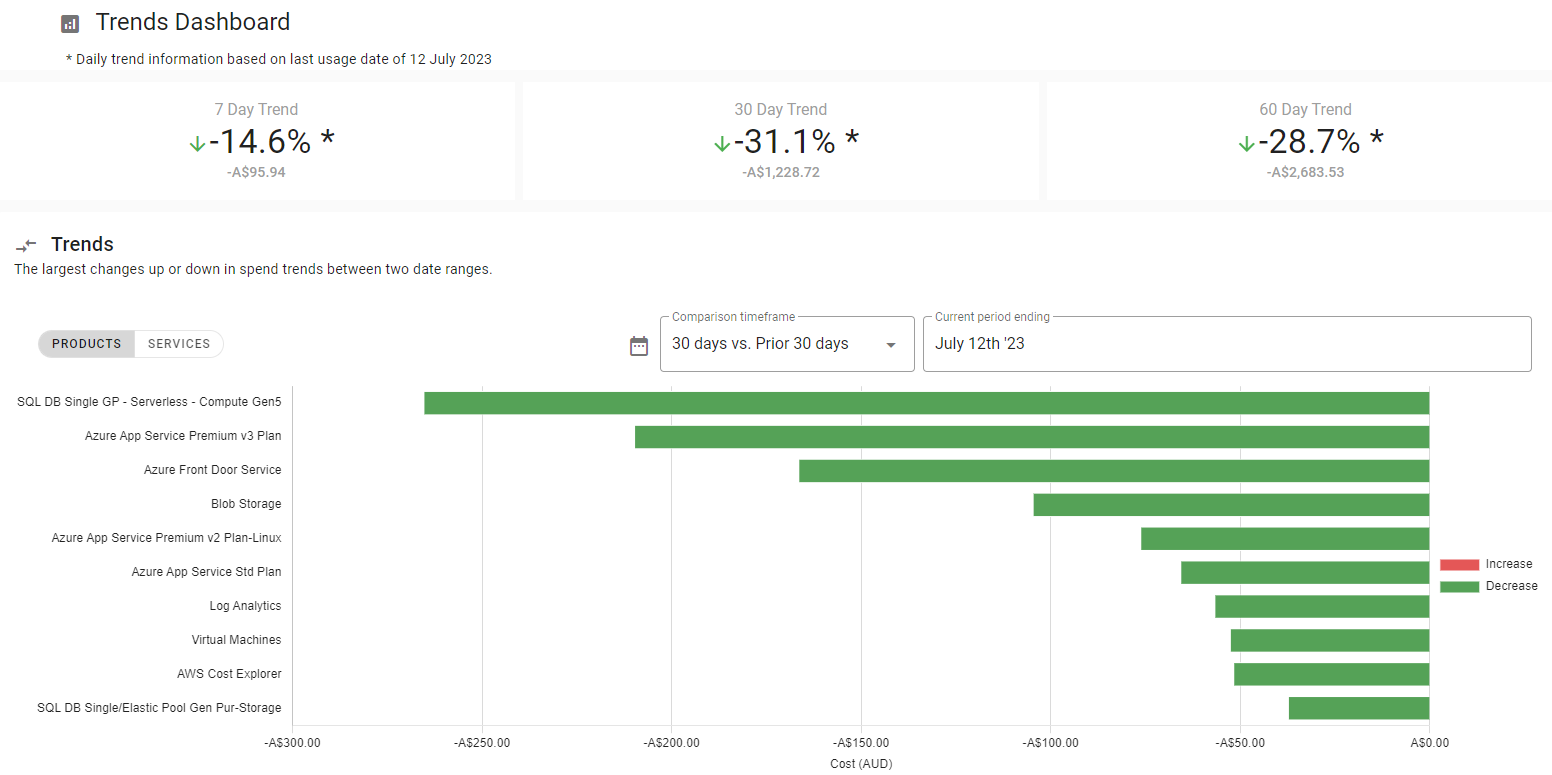
The Trends dashboard provides insight into the top Products and Services that are varying by spend. Entities are compared between two time periods to understand which services and products contributed to the largest differences in spend -/+%.